Visual Explanations
AI Flowcharts & Diagrams: Prompting Multi-Step Guides, Slides, and Maps
Create clean AI generated infographics, multi-step process flowcharts, educational presentation slides, and illustrated food maps using structured prompt frameworks.
In this guide
Infographics, process flowcharts, and technical diagrams are among the highest-engagement assets in content marketing, education, and social media. However, asking an AI image model to produce a coherent diagram often leads to illegible pseudo-text, tangled flow lines, and chaotic visual clutter.
Despite these hurdles, searchers are actively discovering that modern generative models can produce stunning infographic layouts. In Google Search Console, FreeGPTBanana ranks in the top 5 to 7 results for queries like wacky toast / wacky toasting flowchart (pos 5.3), momotaro educational infographic slide (pos 4.5), 3d cartoon tallest buildings infographic (pos 7.0), and hand drawn city food map infographic (pos 26.7).
The key to successful AI infographic generation is understanding what generative models do well (visual metaphors, dimensional icons, color hierarchy, modular cards, spatial maps) and what should be reserved for post-production (exact tabular data, precise microcopy, interactive charts).
In this guide, we break down proven prompt structures to generate four types of informational graphics: multi-step process flowcharts, educational presentation slides, 3D comparative data posters, and illustrated cultural maps. For marketing campaign visuals, also see our AI social media post prompts.
The Golden Rule: Visual Layout First, Text Overlay Second
When generating infographics with AI, avoid demanding paragraph-long body copy directly inside the image. Even the most advanced models may introduce small typographical irregularities.
Instead, structure your prompt to generate Label-Safe Layout Architecture:
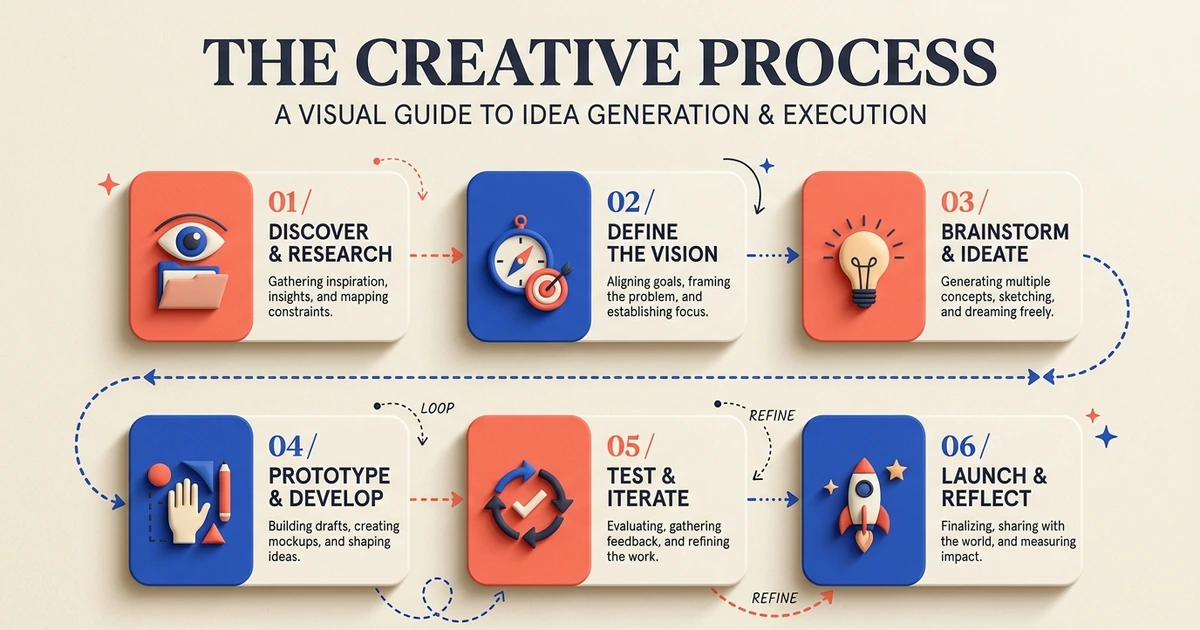
- Modular Card Blocks: Request clean, separated container boxes or rounded cards for each step.
- Directional Flow Vectors: Use connecting dotted lines, arrows, or sequential numbers (1, 2, 3, 4) to establish a clear left-to-right or top-to-bottom reading path.
- Empty Text-Safe Canvases: Explicitly instruct the model to render clean whitespace or blank banner strips inside each card so you can drop in exact vector typography later in Figma, Canva, or Illustrator.
1. Multi-Step Process Flowcharts & Decision Trees
Flowcharts require strict sequential logic, clean connecting nodes, and high-contrast icon metaphors.
The Quirky Step-by-Step Culinary Flowchart
Educational and whimsical process flowchart illustrating “The Art of Perfect Toasting”. Modern flat vector infographic style with clean rounded line art. Four distinct sequential steps arranged in a clean serpentine path:
- Step 1: Choosing the artisanal sourdough slice (illustration of bread loaf).
- Step 2: The chemical Maillard reaction inside a retro chrome toaster (faint glowing heat waves).
- Step 3: Butter melting across golden crispy edges (golden butter pat icon).
- Step 4: Final gourmet toppings (flaky sea salt and herbs). Cream textured paper background, playful mid-century editorial color palette in butter yellow, warm crust brown, and cobalt blue accents. Generous empty card areas for text labels, clear directional arrows.
SaaS User Onboarding Logic Flow
Modern tech product flow diagram explaining a three-tier cloud authentication workflow. Clean minimalist user interface style. Floating isometric glass nodes connected by glowing gradient cyan lines. Clean geometric icons representing user login, biometric verification, and secure cloud database connection. Dark slate background, restrained tech palette, ample padding around each node for UI text callouts.
2. Educational Infographic Presentation Slides
Educational slides demand clear visual metaphors that immediately communicate a concept to students or workshop attendees.
Folklore Narrative Educational Infographic Slide
Comprehensive educational story infographic slide illustrating the traditional Japanese folklore journey of Momotaro (Peach Boy). Split into three horizontal chronological chapters:
- The giant peach floating down a gentle river to the elderly couple.
- Befriending the dog, monkey, and pheasant with millet dumplings.
- Arriving at the mythical Ogre Island fortress. Warm woodblock print-inspired illustration style, soft textured washi paper backdrop, muted earth tones with indigo and coral highlights. Clean rectangular layout with generous bottom margins reserved for narrative educational copy.
Biology Photosynthesis Cellular Diagram
Beautiful scientific educational poster explaining the cellular mechanics of plant photosynthesis. Cutaway diagram of a vibrant green leaf showing internal chloroplast structures and stomata pores. Minimalist dimensional iconography showing sunlight rays entering, water vapor evaporating, and oxygen molecules releasing. Clean pastel educational color scheme, crisp white background, clear circular callout zones for scientific labels, clean layout design.
3. 3D Comparative Data Posters
Comparative infographics visually contrast scale, height, or progression through intuitive spatial relationships.
World’s Tallest Architectural Landmarks Poster
Stylized 3D cartoon comparative height infographic poster featuring famous global towers and skyscrapers arranged from shortest to tallest on a uniform horizontal baseline: Big Ben, the Eiffel Tower, the Empire State Building, and the Burj Khalifa. Smooth clay modeling style, clean pastel gradients, tiny clouds drifting around the upper spires. Clear horizontal height measurement guidelines across the background, generous lower margin for metric labels, fun editorial magazine infographic style.
EV Battery Energy Density Comparison Chart
Clean editorial 3D graphic comparing energy density across battery generations. Three stylized translucent battery cylindrical cells arranged from left to right, each glowing with an increasing percentage of vibrant emerald energy. Polished studio tabletop with soft ambient occlusion shadows, modern Scandinavian aesthetic, white and cool slate backdrop, large open callout badges above each battery for data metrics.
4. Illustrated Cultural & Culinary Food Maps
Maps combine geographical boundaries with playful spot illustrations, making them irresistible on social media and travel guides.
Hand-Drawn City Food Trail Map
Delightful hand-drawn culinary map of Kyoto’s historic Gion district. Stylized watercolor and ink illustration of winding cobblestone streets, small canal bridges with weeping willows, and traditional wooden machiya storefronts. Playful food spot illustrations marking famous stops: matcha parfaits, steaming bowls of dashi udon, skewered dango, and roasted hojicha tea canisters. Pale cream textured paper background, soft earthy tones with pops of cherry red, generous banner title area at the top, charming travel editorial guide aesthetic.
Regional Coffee Culture Illustrated Map
Editorial graphic map illustrating coffee brewing traditions of the Mediterranean. Stylized coastal land outlines with decorative dotted maritime routes. Spot icons showing an ornate copper ibrik pot in Istanbul, a miniature porcelain espresso cup in Rome, and iced frappe glassware in Athens. Vintage maritime chart aesthetic, aged ivory parchment background, deep navy linework with terracotta accents.
How to Prompt for Maximum Diagrammatic Clarity
Use this reliable prompt blueprint when generating diagrammatic assets:
[Infographic Format: e.g., 4-Step Linear Flowchart / Comparative 3D Chart] +
[Topic & Core Metaphor] +
[Structural Layout: e.g., Left-to-right cards connected by dashed arrows] +
[Color Science: e.g., Neutral paper background with 2 accent brand colors] +
[Label-Safe Constraint: e.g., Blank interior card spaces, no rendered small body text]
Pro-Tip: Text-Safe Area Prompting
To ensure your generated diagram leaves clean areas for vector typography, always include this specific negative instruction clause:
Clean layout architecture with generous empty banner ribbons and blank rectangular cards. No garbled micro-text, no faux-rendered body paragraphs, all copy spaces completely flat and untextured for vector typography overlay.
FAQ
Can AI generate accurate data bar charts and line graphs?
AI image models excel at stylized visual comparisons (like relative battery heights or sequential flowchart steps), but they do not calculate mathematical data points accurately. For precise financial charts, generate the background visual in FreeGPTBanana and plot exact data points in design tools like Figma or Canva.
How do I edit text into an AI generated flowchart?
- Generate the diagram in the Imagine workspace.
- Download the high-resolution WebP/PNG output.
- Open the file in Figma, Canva, or Illustrator.
- Place your crisp vector typography, headlines, and data numbers directly into the blank callout cards.
Which style works best for complex technical processes?
Minimalist 3D isometric cards or flat line vector diagrams on neutral cream/white backgrounds work best. Avoid dark, cluttered photographic backdrops which compete with flowchart arrows.
Ready to build your next visual explainer? Open an Imagine workspace session and test these infographic prompt formulas today.
Put the workflow into practice
Create a focused first image
Start with included credits, keep the prompt and references together, and refine the result in your private Imagine workspace.
Open Imagine