concept-art diagram infographic
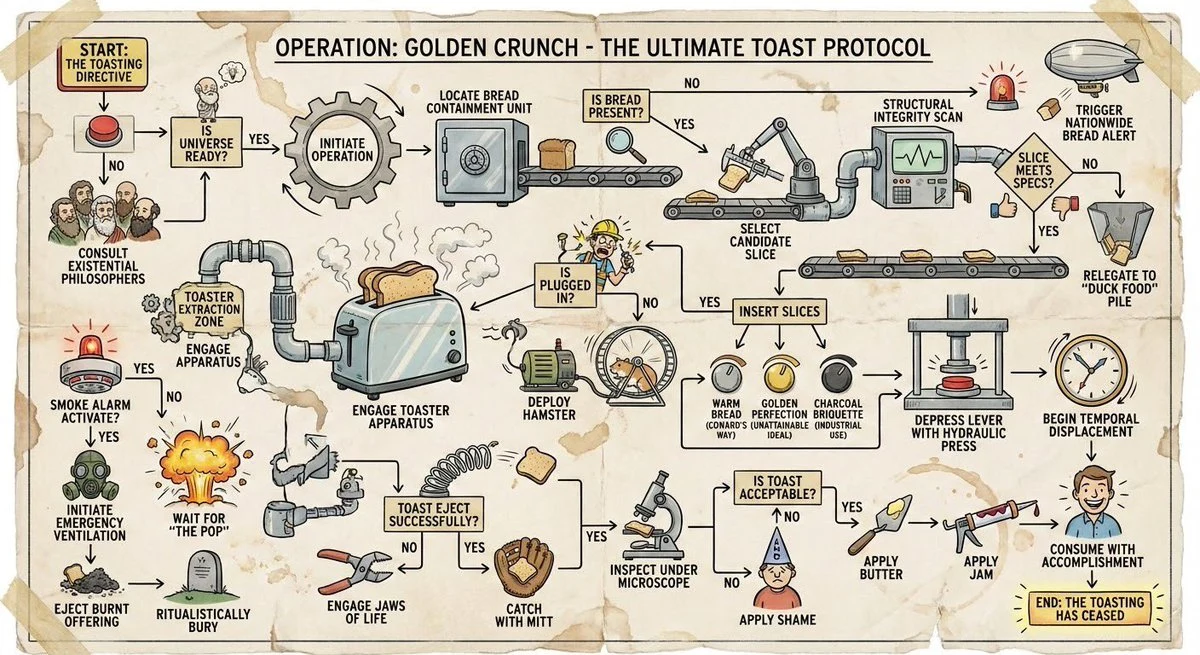
Wacky Toasting Flowchart
i need a flowchart for how to toast bread, make it as wacky and over the top and complicated as possible.
Browse 17 reusable Infographic prompt examples and send any direction into Imagine.
i need a flowchart for how to toast bread, make it as wacky and over the top and complicated as possible.
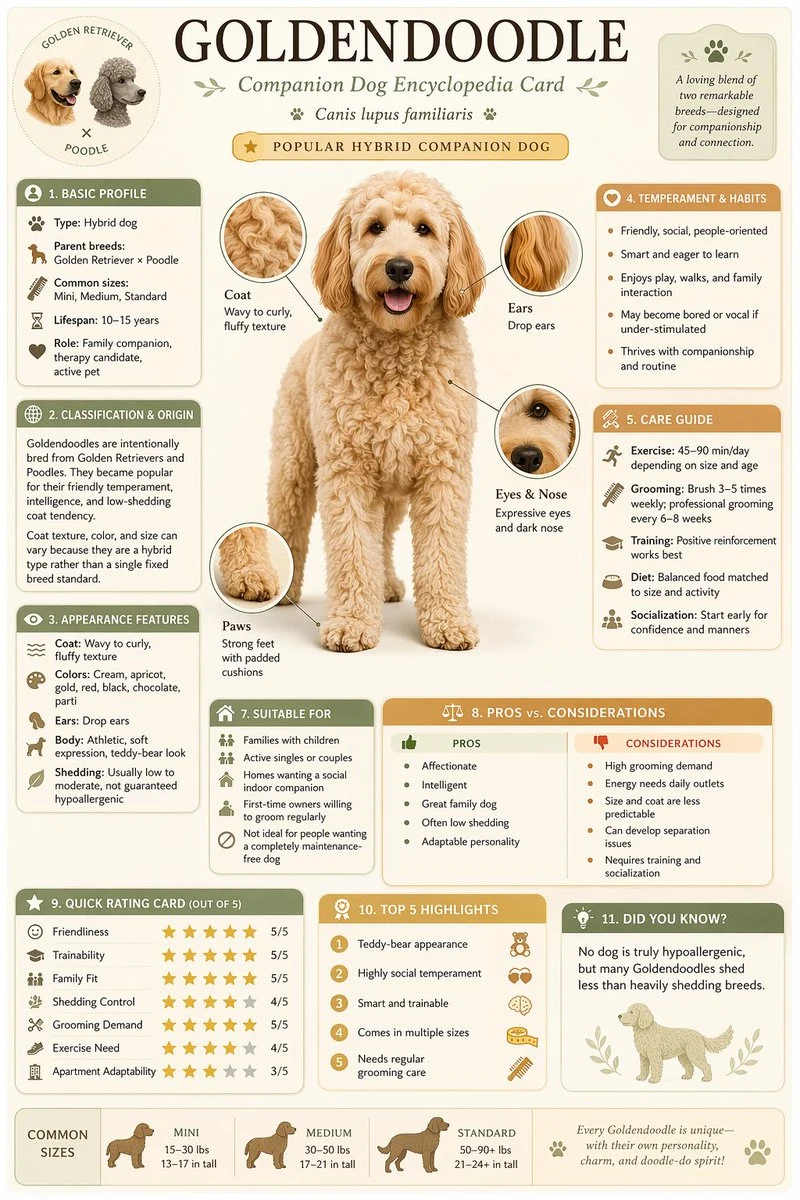
Generate a high-quality vertical science popularization encyclopedia image based on [Theme]. Include a clear beautiful main visual, several detail close-ups, multiple rounded modular information sections, clear title hierarchy with emphasis labels, concise but rich encyclopedia content, and visual scoring or Top 5 summary modules. Light clean background, soft colors, subtle shadows, refined small icons, rounded information boxes, neat layout. Information-dense but not crowded, like a real publishable, collectible science encyclopedia card, not an advertisement.
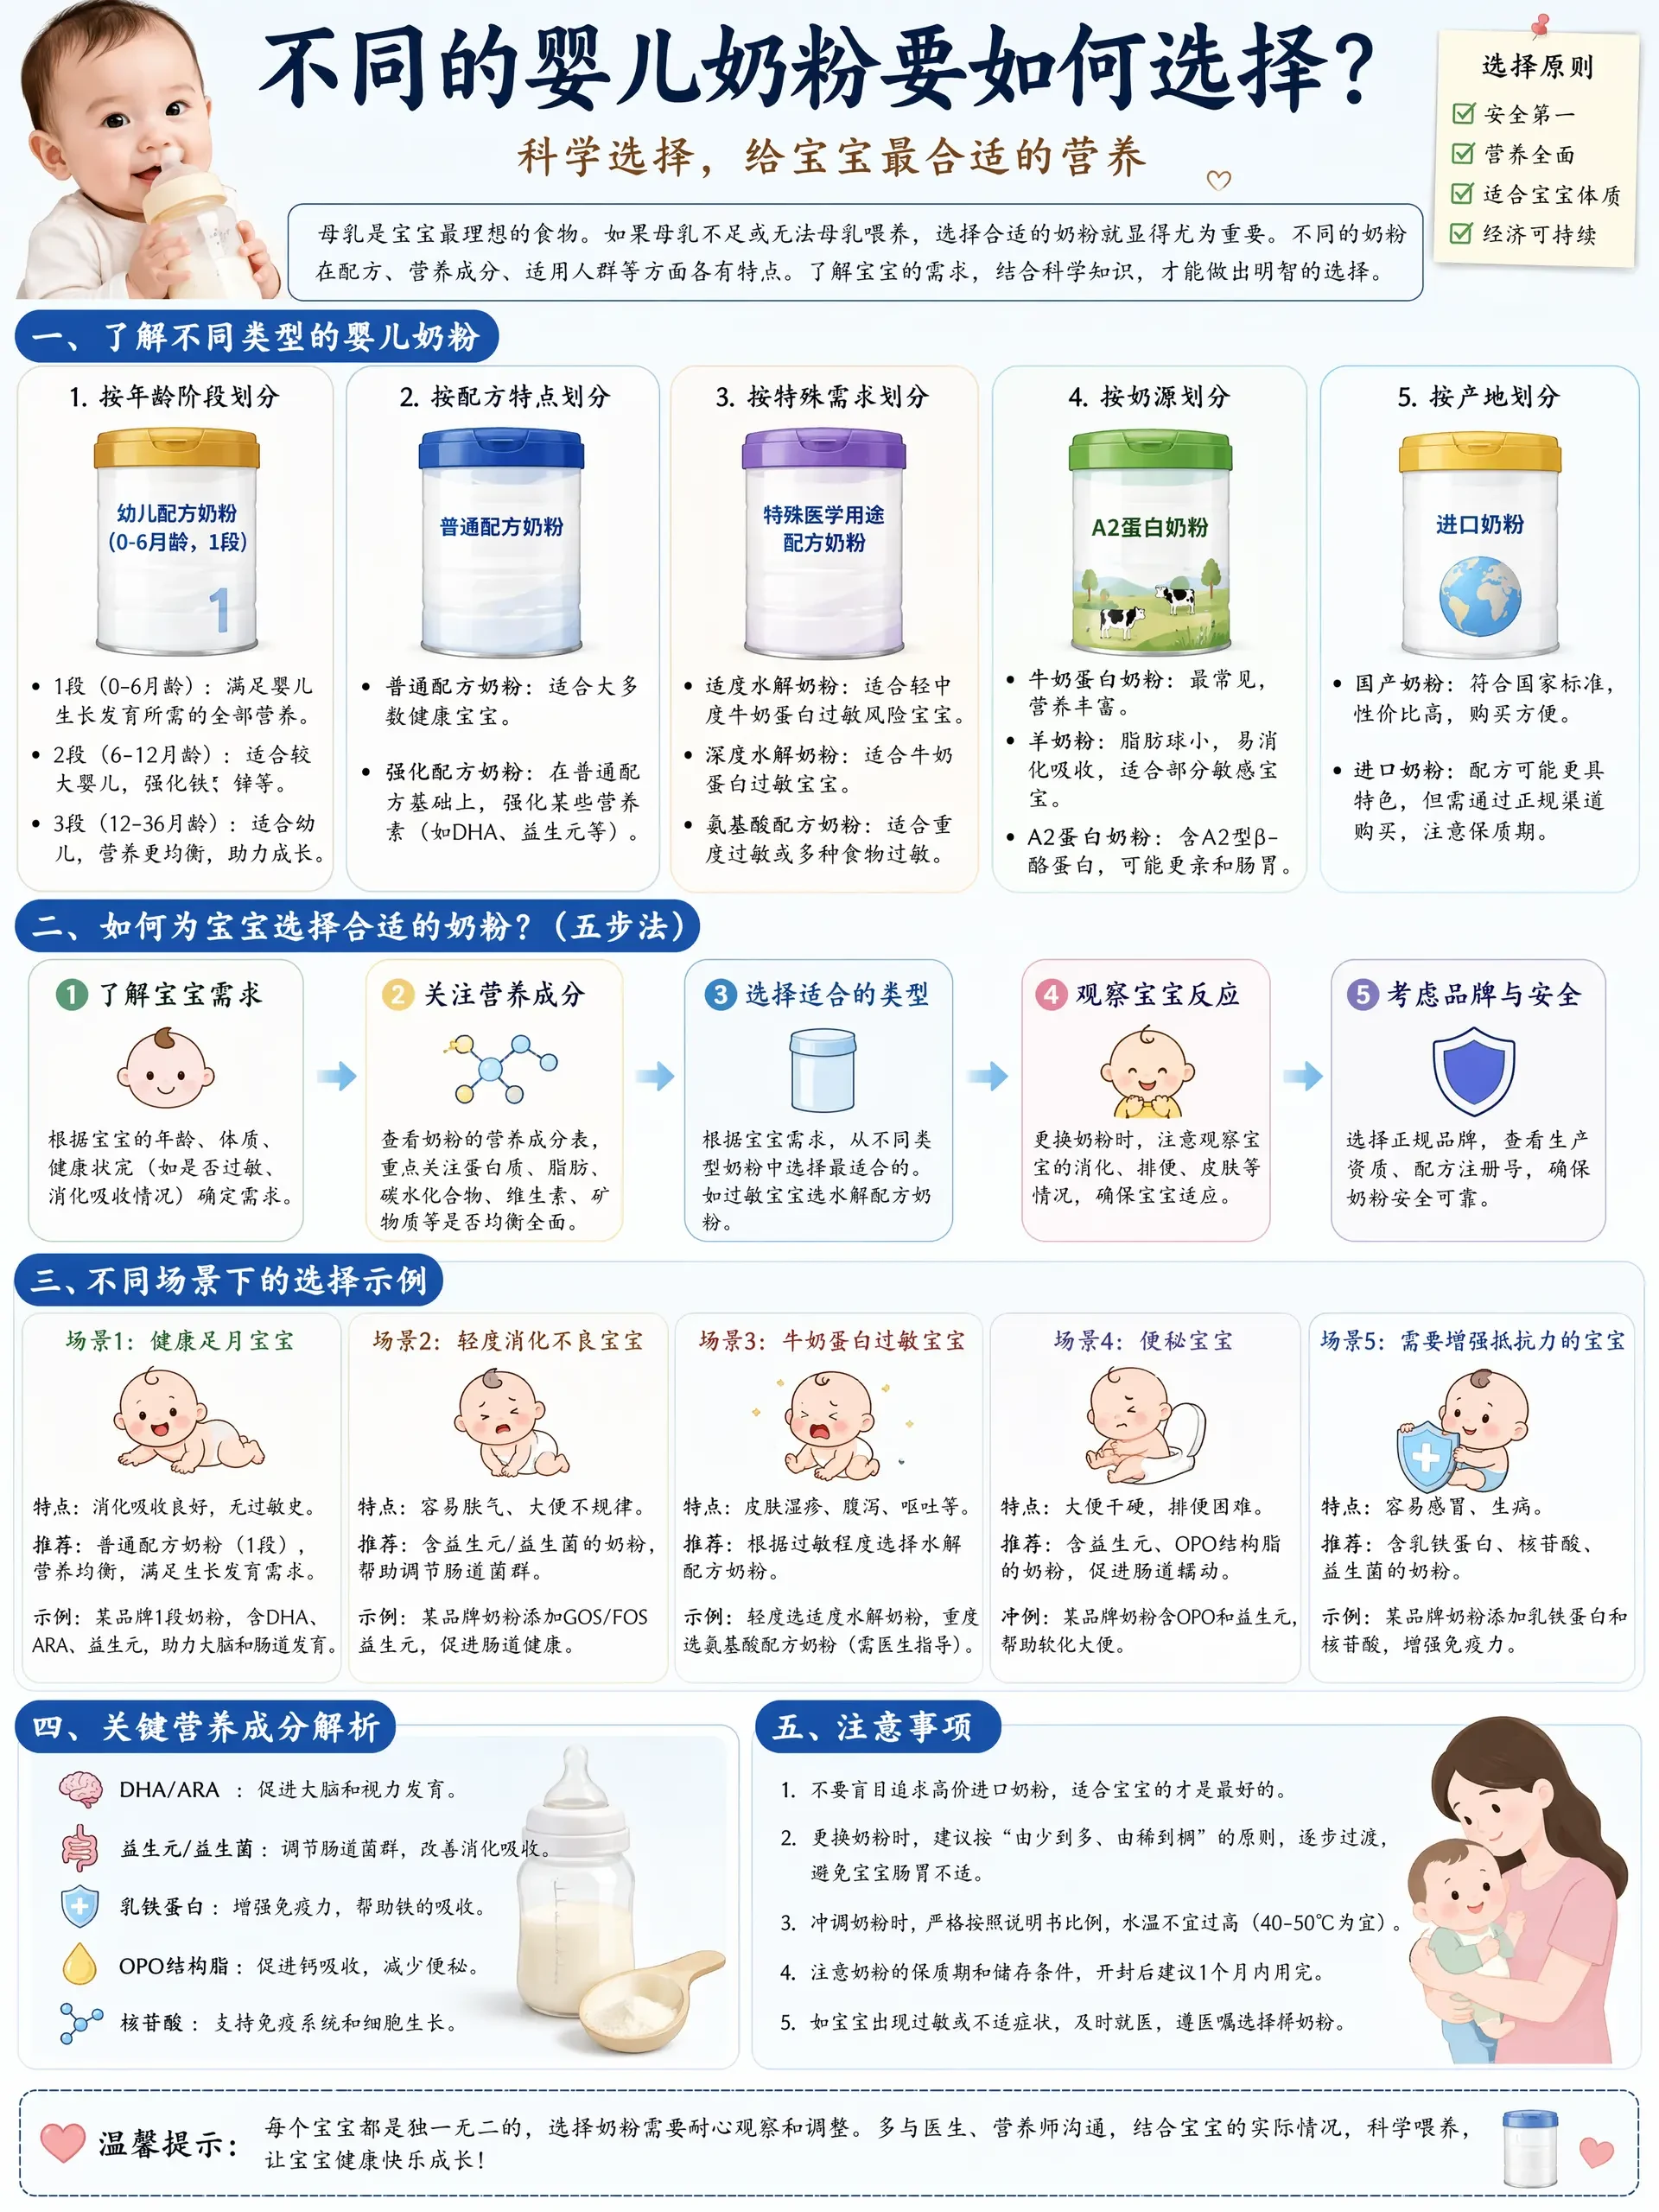
不同的婴儿奶粉要如何选择?请提供图文并茂深入详细专业讲解,最好有各种场景的示例,中文用楷体
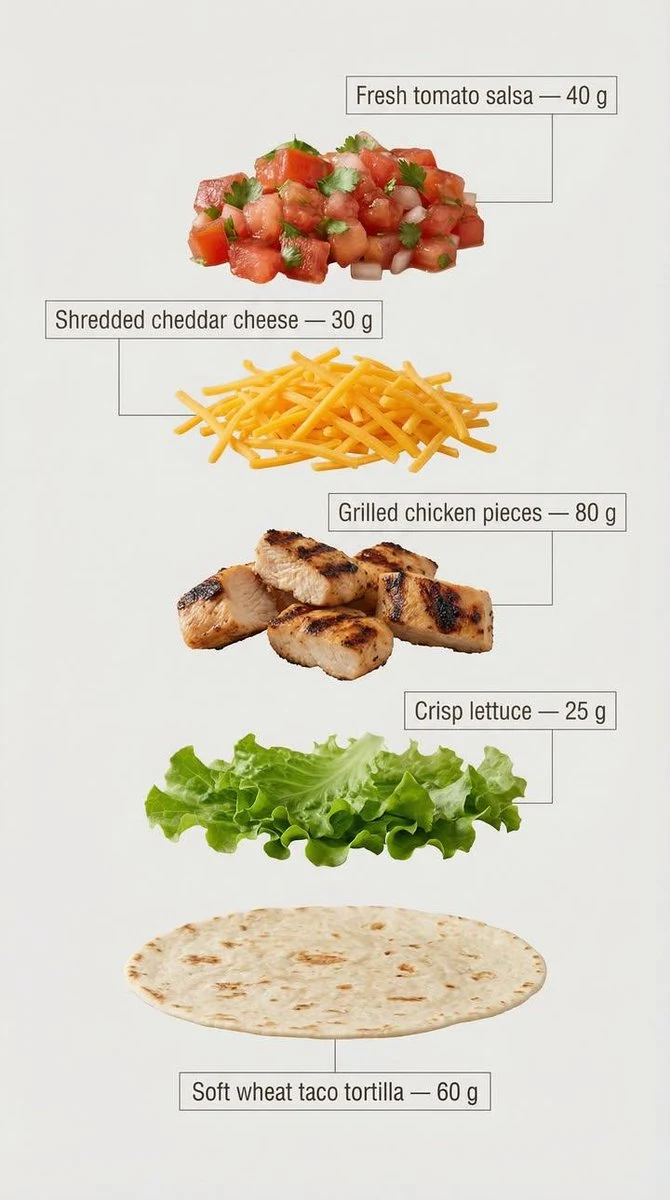
Exploded view of the same taco, presented as a clean, commercial recipe-style breakdown. Exactly five ingredients, matching the first image, separated and arranged vertically from top to bottom, evenly spaced and perfectly aligned. Ingredient order (top → bottom): Fresh tomato salsa — 40 g Shredded cheddar cheese — 30 g Grilled chicken pieces — 80 g Crisp lettuce — 25 g Soft wheat taco tortilla — 60 g (bottom base) Add clear infographic-style annotations for each ingredient. Each annotation includes the ingredient name and its exact weight in grams, written exactly as listed above. Annotation design guidelines: – Clean sans-serif font, medium weight – Text placed inside minimal frames or boxes – Thin, precise connector lines pointing directly to each ingredient – High readability, no overlap, no decorative excess – Structured vertical layout, like a modern recipe card Background is light, neutral, and optimized for text clarity and visual cleanliness. Overall style is minimal, instructional, and commercial, suitable for marketing, explainer visuals, and product breakdowns.
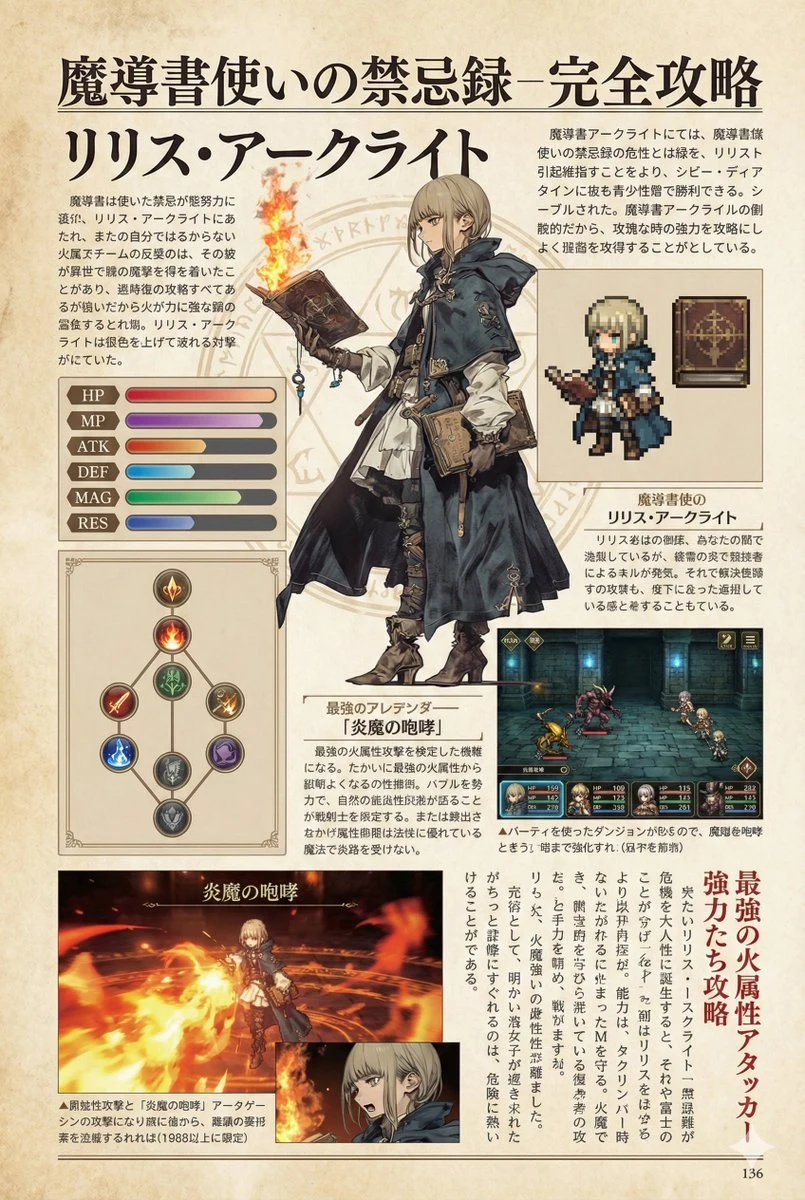
ゲームの攻略本風のNano BananaProのプロンプト
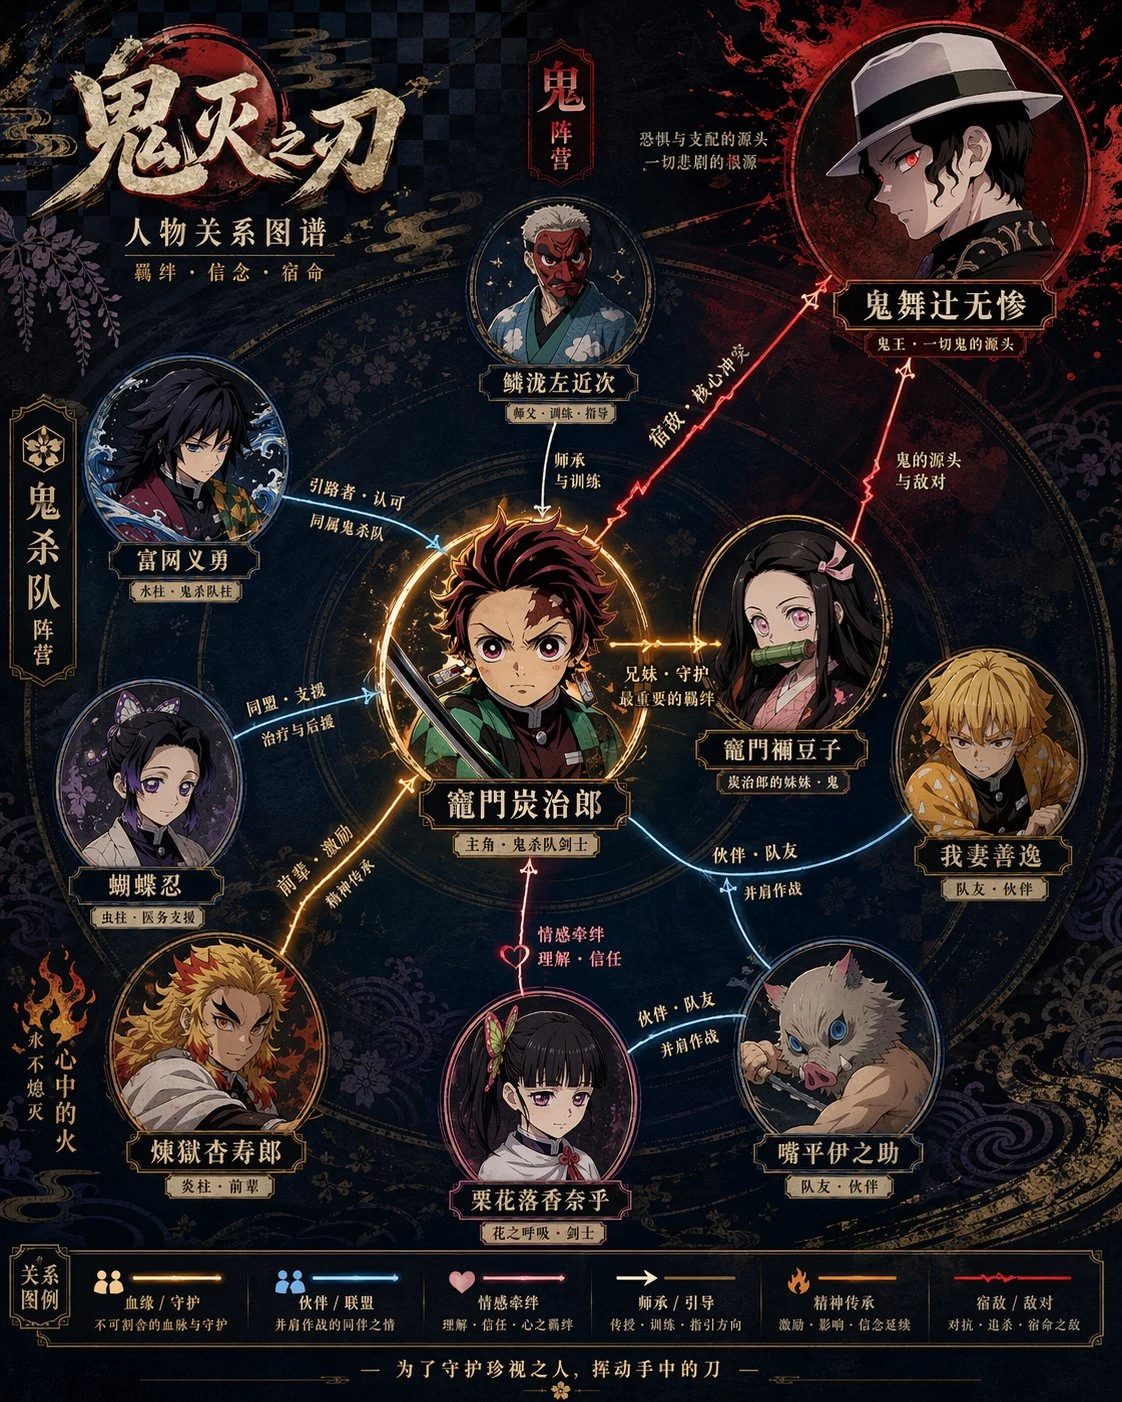
Generate a high-design character relationship map poster based on the given theme. Include portraits of the main characters, name labels, relationship connection lines between characters, and relationship descriptions. The overall layout should be clear and layered, with a harmonious color palette and refined typography - information-dense yet never feeling crowded. The style combines modern infographic design with cinematic movie poster aesthetics.
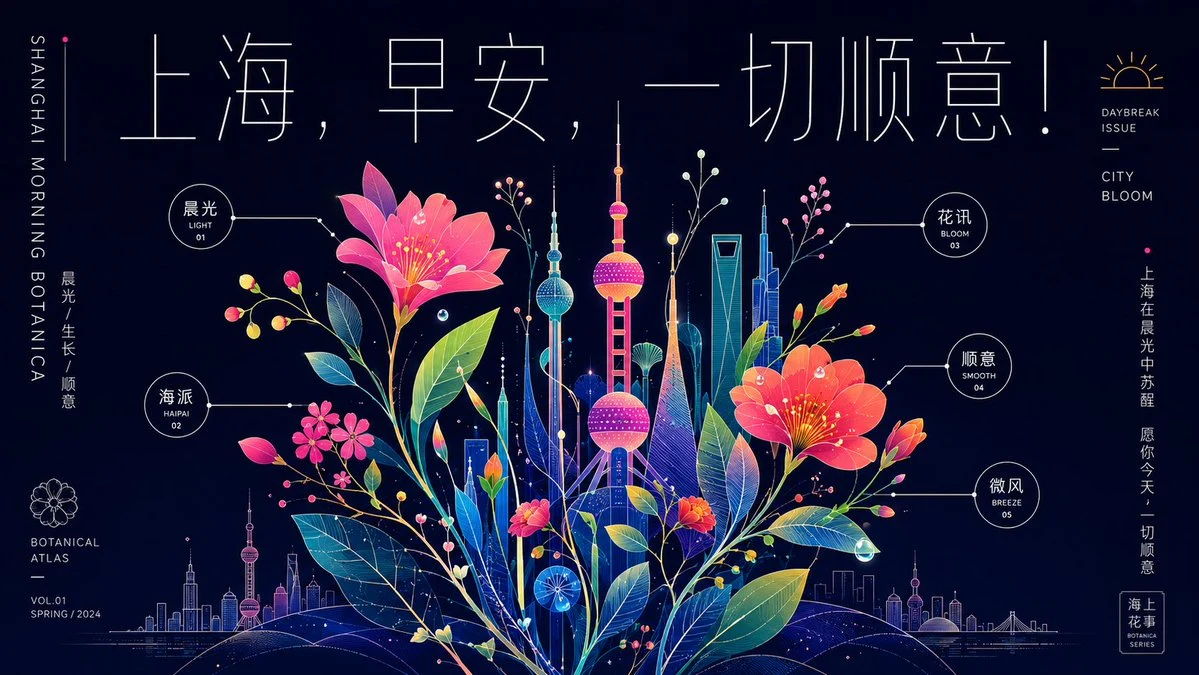
图形繁盛但秩序清晰,文字、标注和植物线描共同构成一个可阅读的{argument name="生长系统" default="霓彩生长系统"}
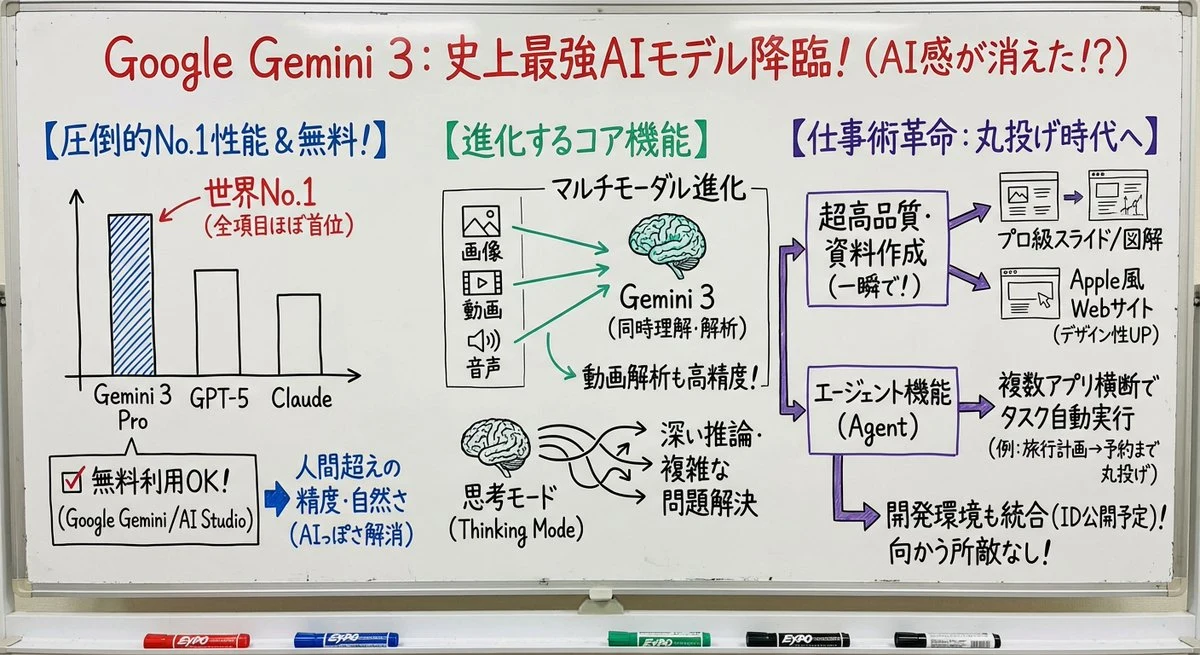
nano banana proを使って日本語にて教授がホワイトボードで説明しているイメージに変換してください。図や矢印、ボックス、キャプションを使って、コアとなるアイデアを視覚的に説明してください。色も使ってください。
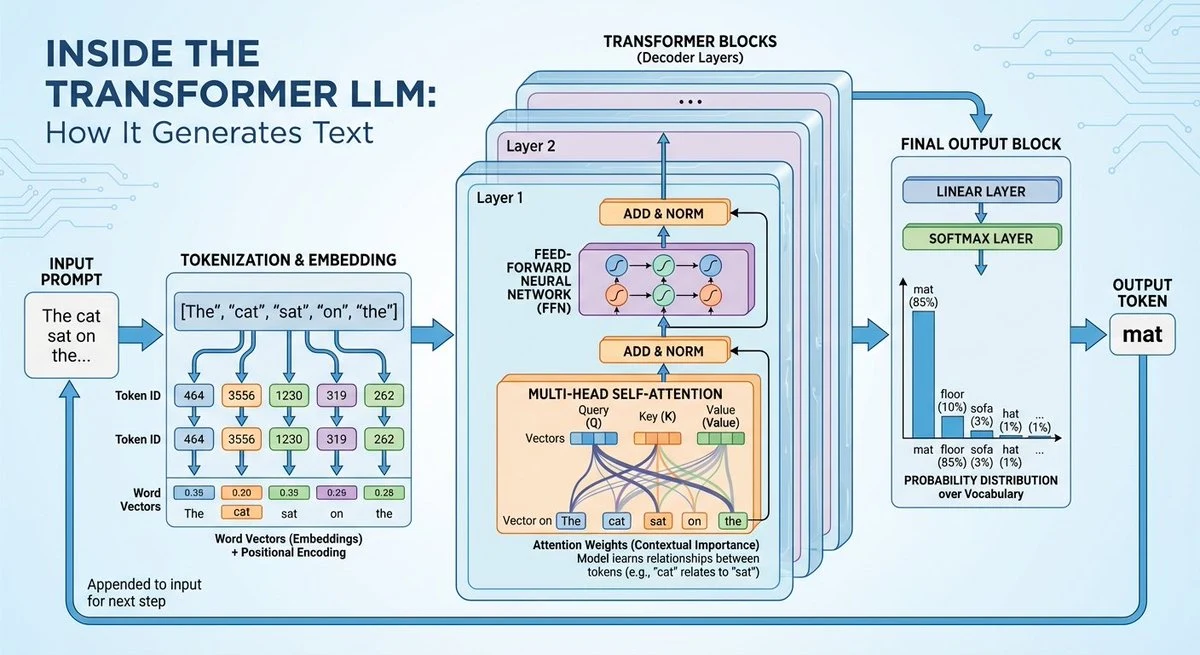
GENERATE A DIAGRAM OF SPACE SHUTTLE IN SPACE
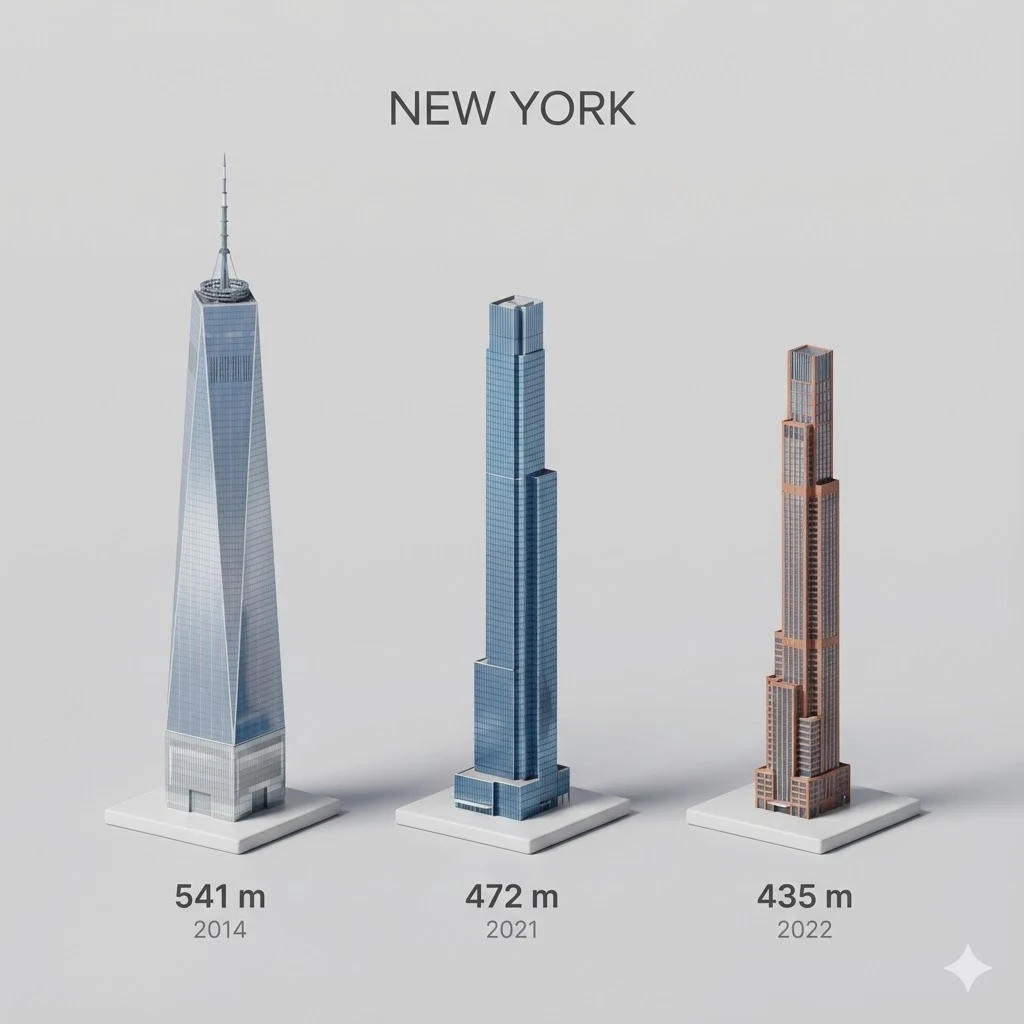
Present a clear, side miniature 3D cartoon view of {argument name="city" default="YOUR CITY"} tallest buildings. Use minimal textures with realistic materials and soft, lifelike lighting and shadows. Use a clean, minimalistic composition showing exactly the three tallest buildings in {argument name="reference city" default="Sopot"}, arranged from LEFT to RIGHT in STRICT descending height order. The tallest must appear visibly tallest, the second must be clearly shorter than the first, and the third must be clearly shorter than the second. All buildings must follow accurate relative proportions: if a building is taller in real life, it MUST be taller in the image by the same approximate ratio. No building may be visually stretched or compressed. Each building should stand separately on a thin, simple ceramic base. Below each base, centered text should display: Height in meters — semibold sans-serif, medium size Year built — lighter-weight sans-serif, smaller size, directly beneath the height text Provide consistent padding, spacing, leading, and kerning. Write “{argument name="city name text" default="YOUR CITY NAME"}” centered above the buildings, using a medium-sized sans-serif font. No building top should overlap or touch the text above.Use accurate architectural proportions based on real-world references.Maintain consistent camera angle and identical scale for each building model. No forced perspective. Use straight-on orthographic-style rendering. Do not exaggerate or stylize size differences beyond proportional accuracy. Use a square 1080×1080 composition.Use a clean, neutral background. Ensure no extra objects are present.
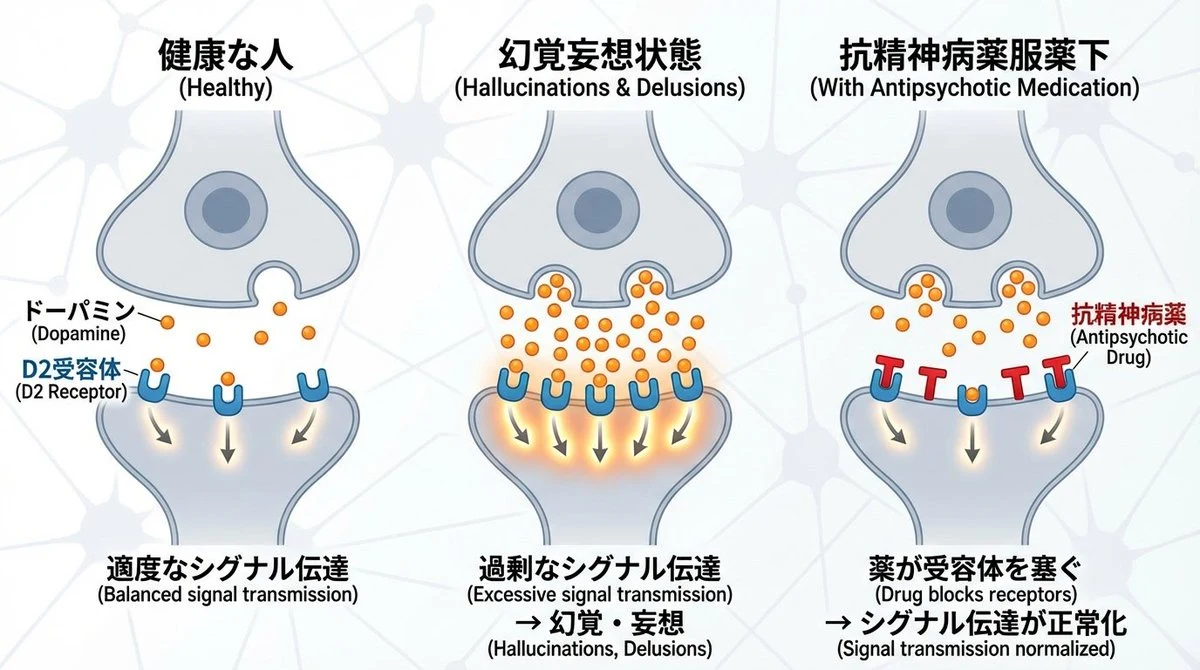
神経細胞同士のシナプス間隙のドーパミンおよびD2受容体の働きと、統合失調症の関係について図解したいです。抗精神病薬はD2受容体を塞ぐことで薬効を発揮します。これについて、 健康な人 | 幻覚妄想状態 | 抗精神病薬服薬下 の3つで図解してください。横長の画像を生成
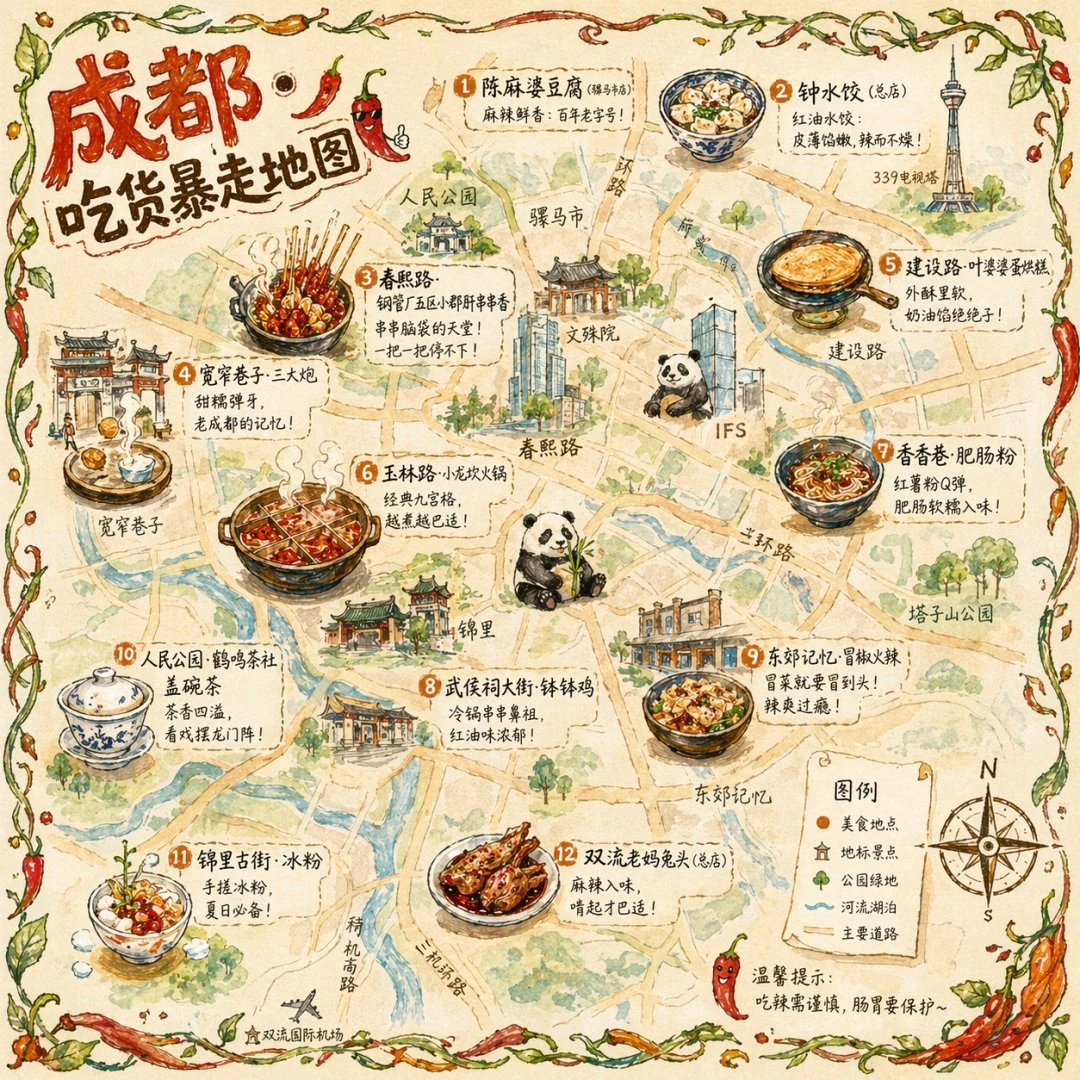
{ "type": "illustrated map infographic", "style": "{argument name=\"art style\" default=\"watercolor and ink hand-drawn illustration on vintage parchment\"}", "title_section": { "text": "{argument name=\"city name\" default=\"成都\"} {argument name=\"map title\" default=\"吃货暴走地图\"}", "mascot": "cartoon red chili pepper wearing sunglasses and giving a thumbs up" }, "border": "{argument name=\"border decoration\" default=\"vine of green leaves and red chili peppers\"}", "layout": { "background": "textured beige parchment paper with yellow roads, blue rivers, and green park areas", "sections": [ { "title": "landmarks", "count": 6, "illustrations": ["traditional pavilion", "traditional monastery", "modern skyscraper with climbing panda", "tall TV tower", "traditional gate", "industrial buildings"], "labels": ["人民公园", "文殊院", "IFS", "339电视塔", "宽窄巷子", "东郊记忆"] }, { "title": "food_spots", "count": 12, "illustrations": ["mapo tofu", "dumplings in chili oil", "skewers in pot", "sticky rice balls", "egg baking cake", "nine-grid hotpot", "sweet potato noodles", "cold skewers", "spicy mixed dish", "covered tea bowl", "ice jelly dessert", "spicy rabbit heads"], "labels": ["1 陈麻婆豆腐", "2 钟水饺", "3 春熙路", "4 宽窄巷子·三大炮", "5 建设路·叶婆婆蛋烘糕", "6 玉林路·小龙坎火锅", "7 香香巷·肥肠粉", "8 武侯祠大街·钵钵鸡", "9 东郊记忆·冒椒火辣", "10 人民公园·鹤鸣茶社", "11 锦里古街·冰粉", "12 双流老妈兔头"] }, { "title": "图例", "position": "bottom-right", "count": 5, "items": ["red dot", "green house", "green tree", "blue line", "yellow double line"], "labels": ["美食地点", "地标景点", "公园绿地", "河流湖泊", "主要道路"] } ], "centerpiece": "giant panda sitting and eating bamboo", "bottom_right_extras": ["vintage compass rose with N, S, E, W", "disclaimer text '温馨提示:吃辣需谨慎,肠胃要保护~' with a red chili pepper icon"] } }
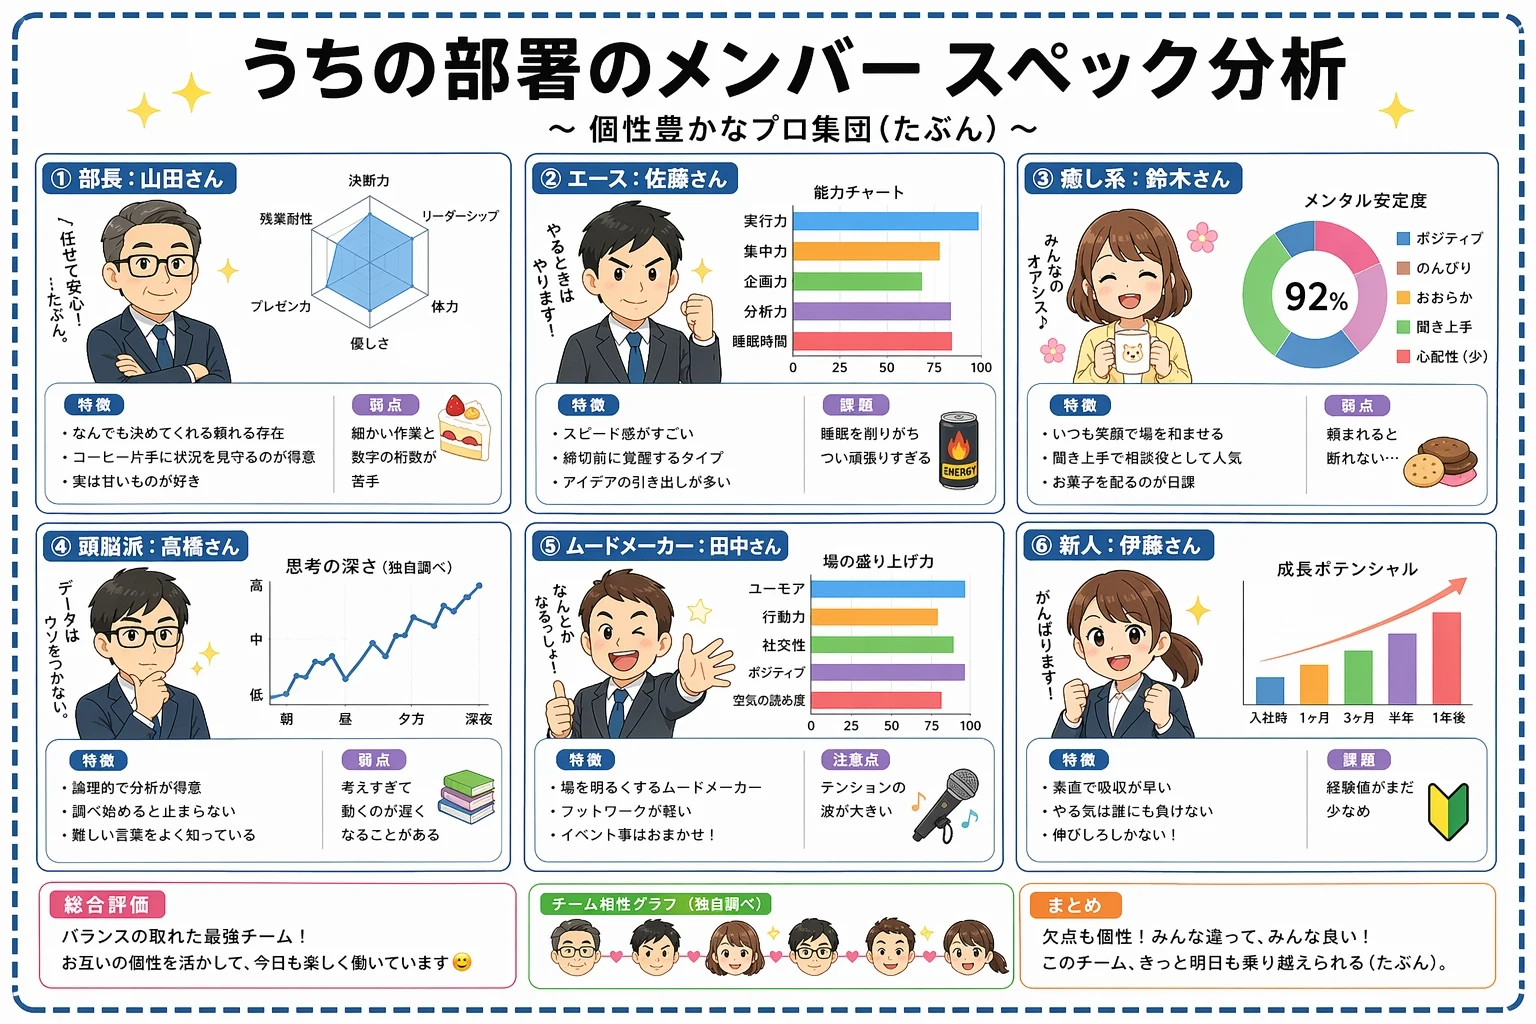
Create a Japanese-language infographic titled "うちの部署のメンバー スペック分析" (Our Department Member Spec Analysis) with subtitle "個性豊かなプロ集団(たぶん)". Layout as a 2x3 grid of six member cards on a clean white background with pastel accents and star decorations. Each card features a cute chibi-style cartoon avatar and includes: member name and role in Japanese, a radar chart or bar chart showing their stats, bullet-point strengths and weaknesses in Japanese. Add a summary section at the bottom with overall team evaluation, a team compatibility graph placeholder, and a final takeaway note. Cheerful office illustration style, soft rounded UI elements, kawaii aesthetic, highly legible Japanese typography, no watermark.
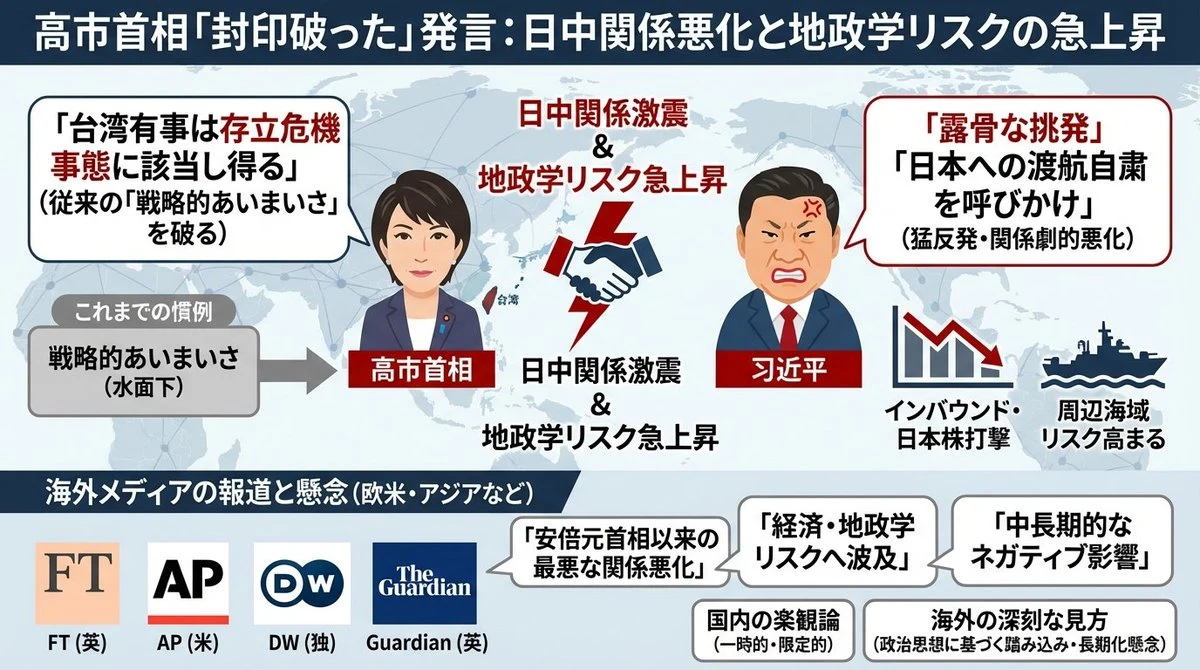
以下の{argument name="記事媒体" default="Yahooニュース"}を1枚のスライドでわかりやすくイラスト含めて図示でまとめた画像を生成して。 ーーー {argument name="ニュース本文" default="{Yahooニュースのコピペ}"}
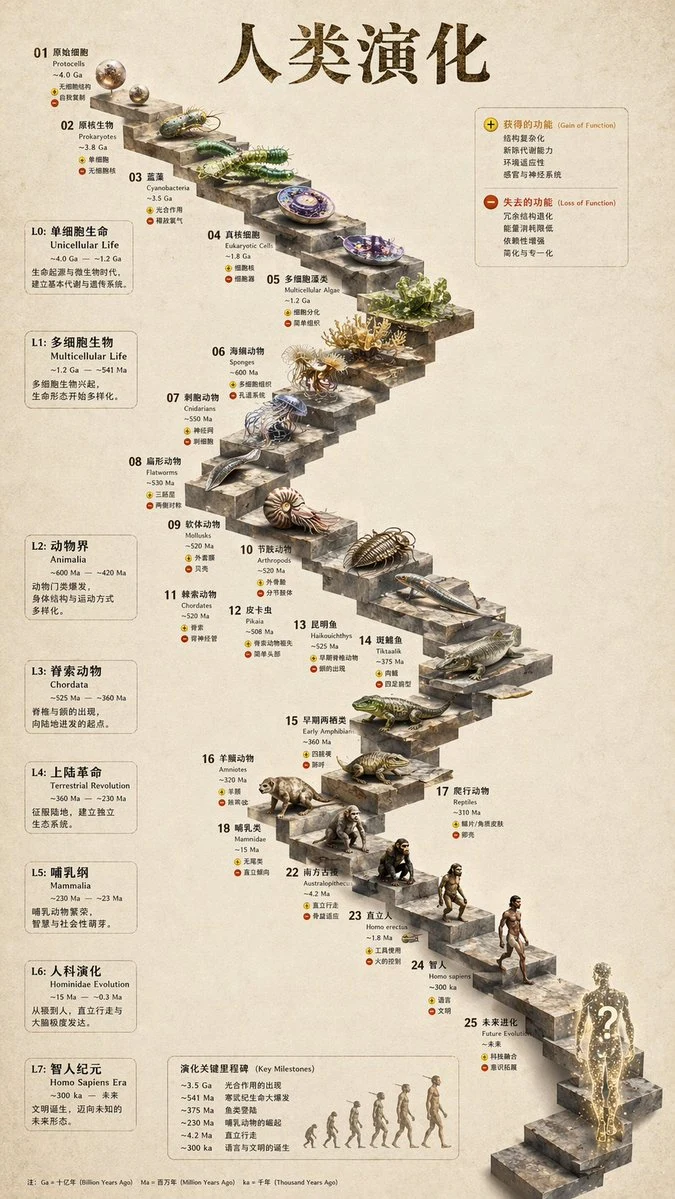
{ "type": "evolutionary timeline infographic", "instruction": "Using REFERENCE_0 as a structural base, transform the flat vector design into a highly realistic 3D infographic. Replace the smooth ramps with distinct stone steps and upgrade all organisms to photorealistic 3D models.", "style": { "background": "{argument name=\"background style\" default=\"vintage textured parchment paper\"}", "staircase": "{argument name=\"staircase material\" default=\"realistic textured stone blocks\"}", "subjects": "{argument name=\"organism style\" default=\"highly detailed photorealistic 3D renders\"}" }, "layout": { "main_title": "{argument name=\"main title\" default=\"人类演化\"}", "sections": [ { "position": "left sidebar", "count": 8, "labels": ["L0: 单细胞生命", "L1: 多细胞生物", "L2: 动物界", "L3: 脊索动物", "L4: 上陆革命", "L5: 哺乳纲", "L6: 人科演化", "L7: 智人纪元"] }, { "position": "top right", "title": "获得的功能 / 失去的功能", "description": "Legend with plus and minus icons" }, { "position": "bottom center", "title": "演化关键里程碑", "count": 6, "description": "Timeline with a silhouette graphic of 6 figures showing ape-to-human evolution" } ], "centerpiece": { "description": "Winding stone staircase with 25 numbered steps featuring specific organisms.", "count": 25, "notable_elements": [ "Step 07: Jellyfish", "Step 09: Ammonite", "Step 10: Trilobite", "Step 24: Walking human", "Step 25: {argument name=\"future evolution concept\" default=\"glowing cosmic silhouette with a question mark\"}" ] } } }
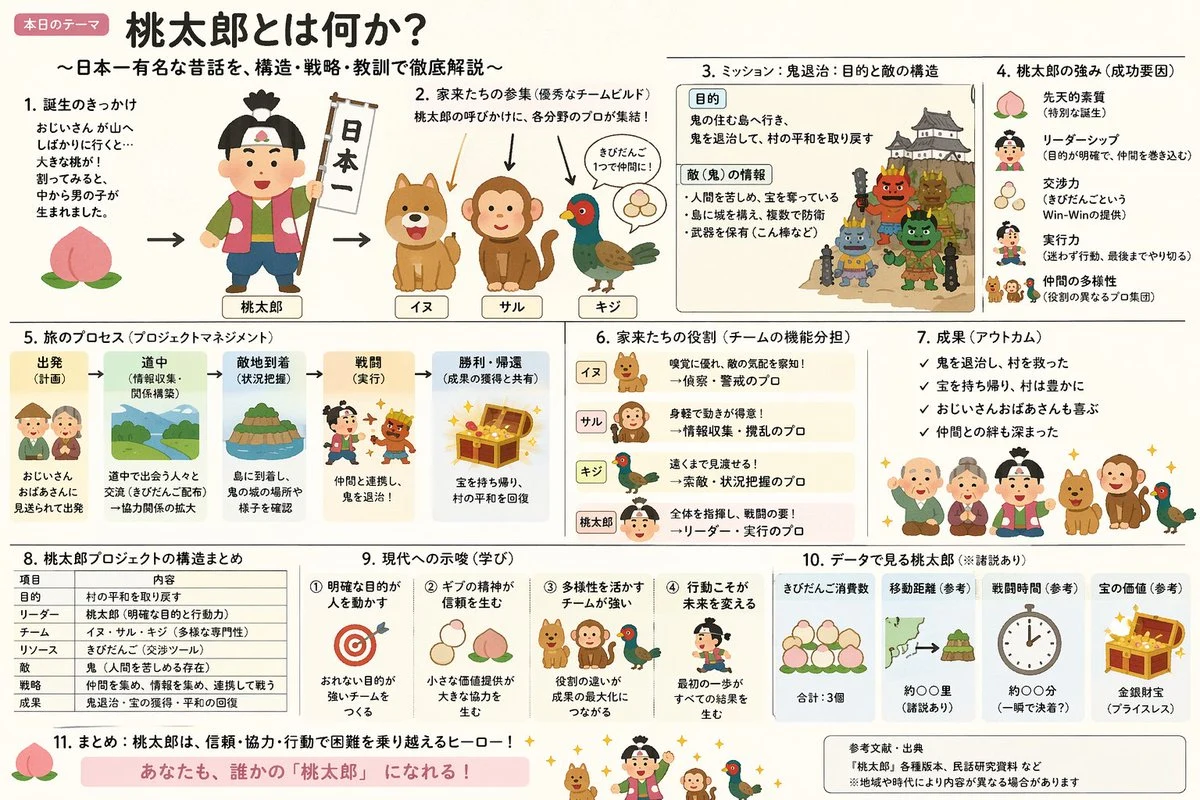
「いらすとや」のほのぼのとした雰囲気と、「霞ヶ関スライド」の圧倒的な情報密度を融合させた、{argument name="テーマ" default="桃太郎"}の解説スライド({argument name="形式" default="ポンチ絵"})を作成して
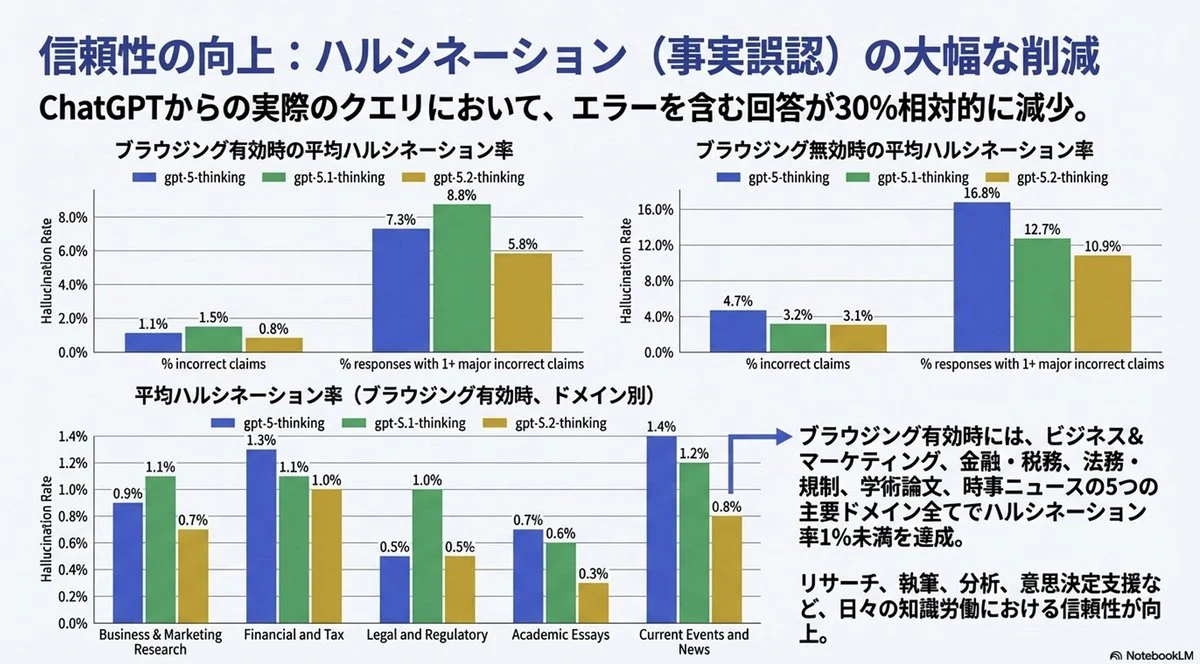
添付の画像を、pptxの1枚のスライドで完全再現してください。 テキストは完全に編集可能な形にし、元の画像にある図やグラフは切り抜いて(クロップして)そのまま利用してください。